Video Plan Simulation
This reference guide walks through how to setup & configure the video pacing simulator, and some background on the why’s and methodology involved
Video Simulator
The video plan simulator allows us to simulate the impact of changes in video pacing (timing) and investment levels across a plan period. To do this we use the response functions and coefficients as measured in an econometric model, the reach/frequency build curves that relate TVRs/GRPs/TARPs to % reach and effective cover, and the client-specific financial return model.
Building the databases
The simulator draws data from 3 tables to inform the calculations, and the client-specific financial return models.
Response Table
Spot Length Table
Video Reach Curve Table
The video reach curve table holds the databased parameters of the reach curves used to convert TVRs/GRPs/TARPs into the % of people that have been reached by an ad 1 (or more) times, 2 (or more) times, etc.
The database is brand-specific, and has input columns for
- brand (the name of the client/brand as it appears in the tool and other database tables)
- market (the name of the market as it appears in the tool and other database tables)
- name (the name of the reach curve set as it will occur in the tool)
- param (the parameter label, either a,b, or,c from the below)
- 1+ ….. 10+ (the frequency levels for which the parameters apply)
Calculating Video Reach Curve Parameters
Video reach curves are databased based the a, b, and c parameters from the below function, for each frequency level that we want to know the % reach at. This function and parameterization is know to fit reach frequency curves well.
\[\% \text{ Reach } = \frac{a}{1 + b \left(\frac{GRPs}{1000}\right)^c}\]To calculate the parameters of the curves, we need to load in data showing the reach/frequency relationships and run a parameterization routine. The econometric modeling app has this code and functionality already built in: was can leverage this code.
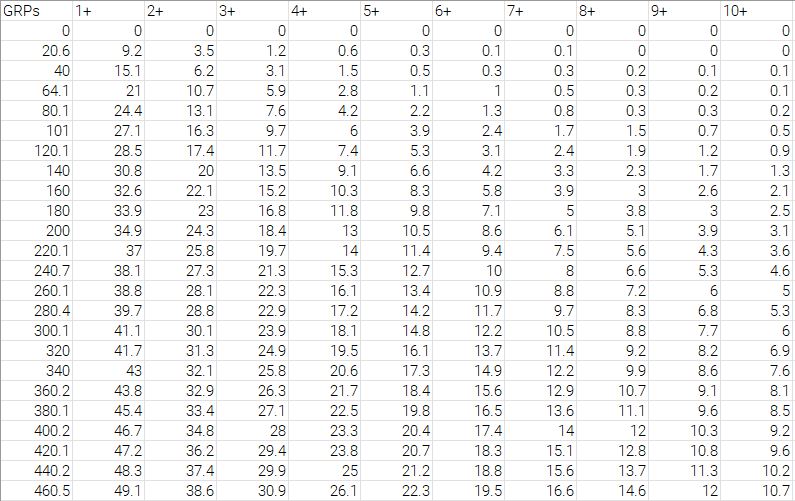
The input data for this routine should be in the same format as the TVReach.csv file used in the econometric modeling app. Specifically the data file should have a column of GRPs/TVRs/TARPs (labelled as “GRPs”), ideally with at least 50 observations (altough we can often relax this to about 20) spaced evenly from 0 to about 4x the highest weekly TVR/GRP/TARP weight level that a client has run in a given month. The file should also have the % reach (in whole number format, so 25% is shown as 25.00) at 1+ to 10+ reach levels. An example of this is shown below
To parameterize the reach curves into the required format, we leverage the routines in the econometric modeling app, and can use the below code snippet
# Simple R code for reach frequency curve parameterization
library(dplyr)
library(tidyr)
library(data.table)
# note, the below source file also requires VariableTransformations.cpp to be in the same directory
source("rFunctionTransfromVariables.r")
# read in the raw GRP to reach table
video.reach.data=as.data.frame(data.table::fread("TVReach.csv"))
# routine can run a weighted parameterization to over-weight certain observations, if we have odd input data
# currently setting this value to 1 for all observations so that they have equal weight
video.reach.weights=as.data.frame(matrix(nrow=nrow(as.data.frame(video.reach.data)), ncol=1, data=1))
# parameterize the reach frequency curves
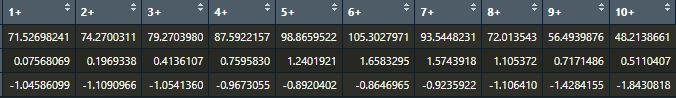
video.reach.params = ReachFit(afData = video.reach.data,
afWeights = video.reach.weights)With this code run, the resulting output should be a dataframe of the 3 parameters that represent the curve
To further check that the curve parameterization has been done accurately, we can use the econometric model EDA functions to plot the input data points Vs the fitted curve(line) at each frequency level as follows
library(ggplot2)
library(lubridate)
library(route1io)
library(scales)
source("rFunctionEDA.r")
colors_custom=colors_route1io
theme_custom=theme_route1io
get.eda.tv.reach.chart(video.reach.data)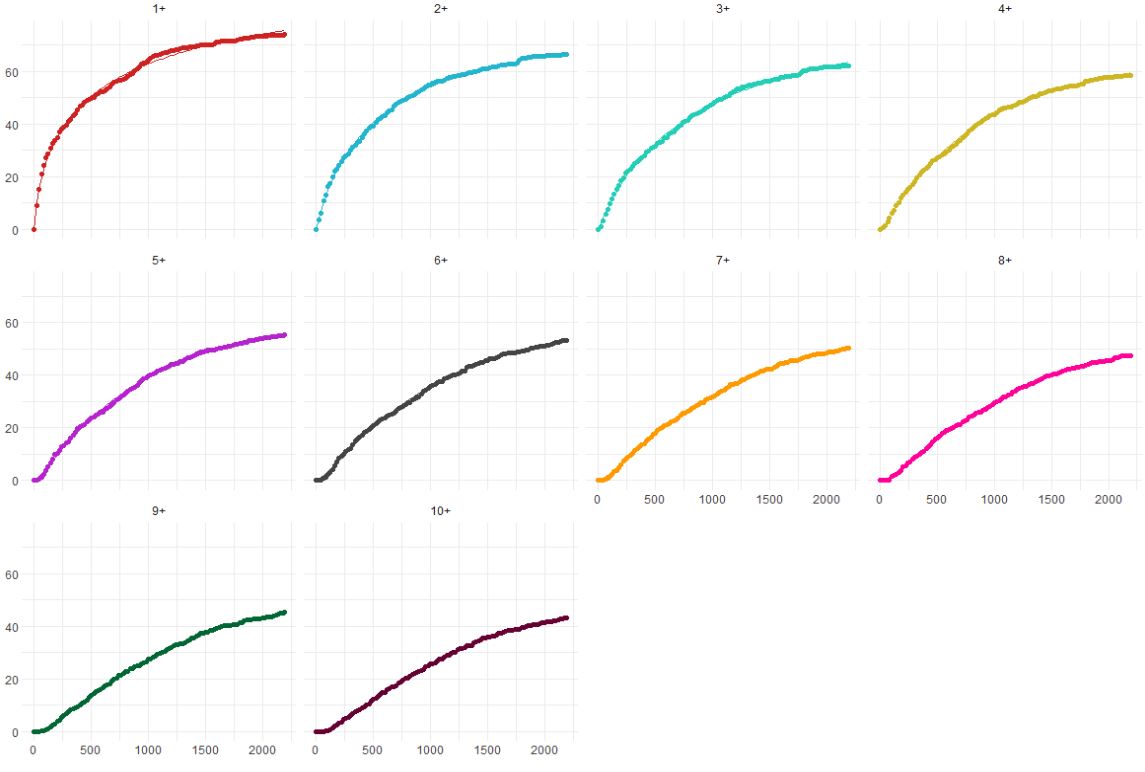
The resulting output table can then be added to the reach curves database within the video pacing tool