Model tests: Recursive and Bootstrap Approaches
The recursive and bootstrap approaches are two model tests with the econometrics tool.
The recursive approach provides a temporal look at the model stability, while the bootstrap approach provides a distributional assessment of coefficient variability and robustness through resampling. These techniques help evaluate a model’s performance under different data conditions.
Recursive
The recursive approach involves sequentially fitting the same regression model over time, and updating the sample by adding new observations. This is done by fitting the model using data up to time \(t\). The add the next observation \((t+1)\) and refit the model. This helps track how coefficients evolve over time, which is useful for identifying model instability. Currently, the recursive approach focuses only on coefficient tracking.
The code contains 3 main functions, these are (1) recursive model Fitting (recursive.apply), (2) generating the recursive table (get.recursive.table), and (3) plotting the results (get.recursive.chart).
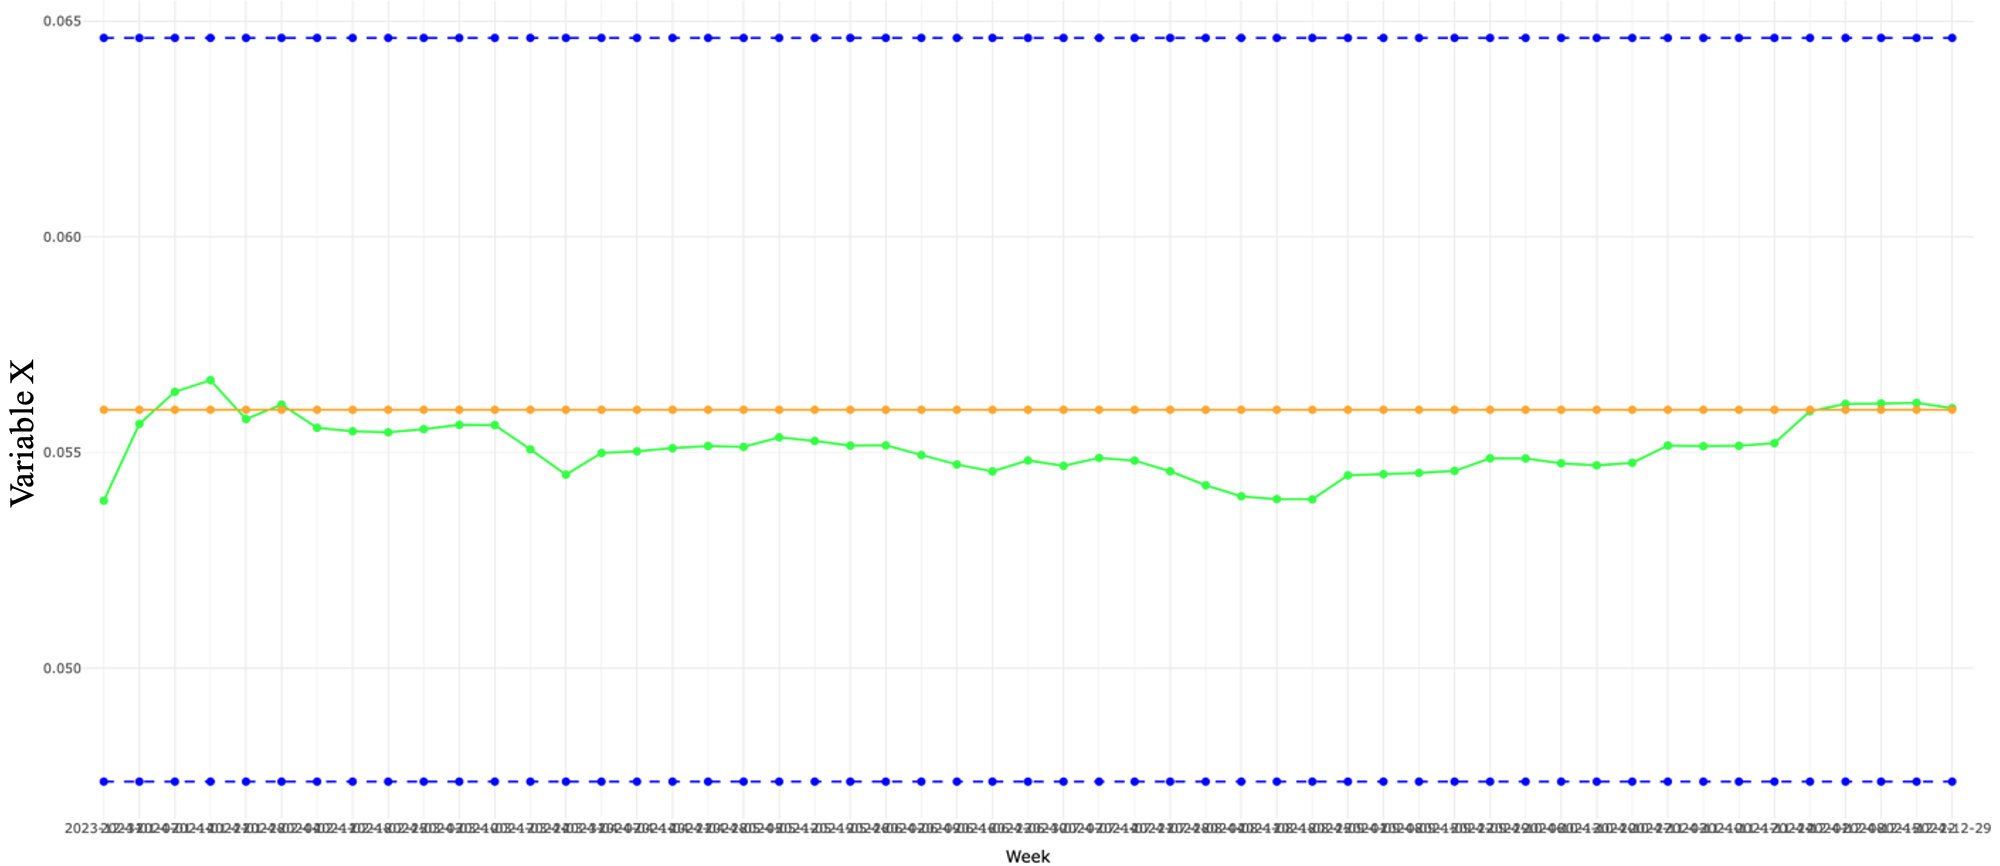
The Figure below illustrates the weekly evolution of ‘Variable X’ over time, with the Y-axis representing its \(B\) coefficient. This is a good example of sustained consistency over time.
- Green Line (with dots): Represents the \(B\) coefficient over time.
- Orange Line (with dots): Represents the value of the \(B\) coefficient at the most recent week.
- Blue Dashed Lines (above and below): These lines represent the 90% confidence intervals.
When to use the recursive approach: When we suspect there are potential points in time where the underlying relationship between variables might have shifted. Good for detecting structural breaks or trends in coefficients over time.
Bootstrap
The bootstrapping approach is a resampling technique that involves repeatedly sampling from the data with replacement and fitting the same regression model to each resample. This provides insights into the stability of the model estimates across the varied dataset samples. By examining the variability in the coefficients obtained from the output during the bootstrapping procedure, it is demonstrated how changes in the input dataset, such as sample size, can lead to variability in the model output. This helps to provide more oversight into the strength and consistency of the associations between the outcome and the predictors thereof. This can be particularly helpful in identifying false or weaker associations that are not regularly observed across identical models by using slightly different subsamples of data as input. If an association is consistently observed across various models with different data subsets, it adds more weight to its validity. This approach can help identify which associations are robust and which might be spurious.
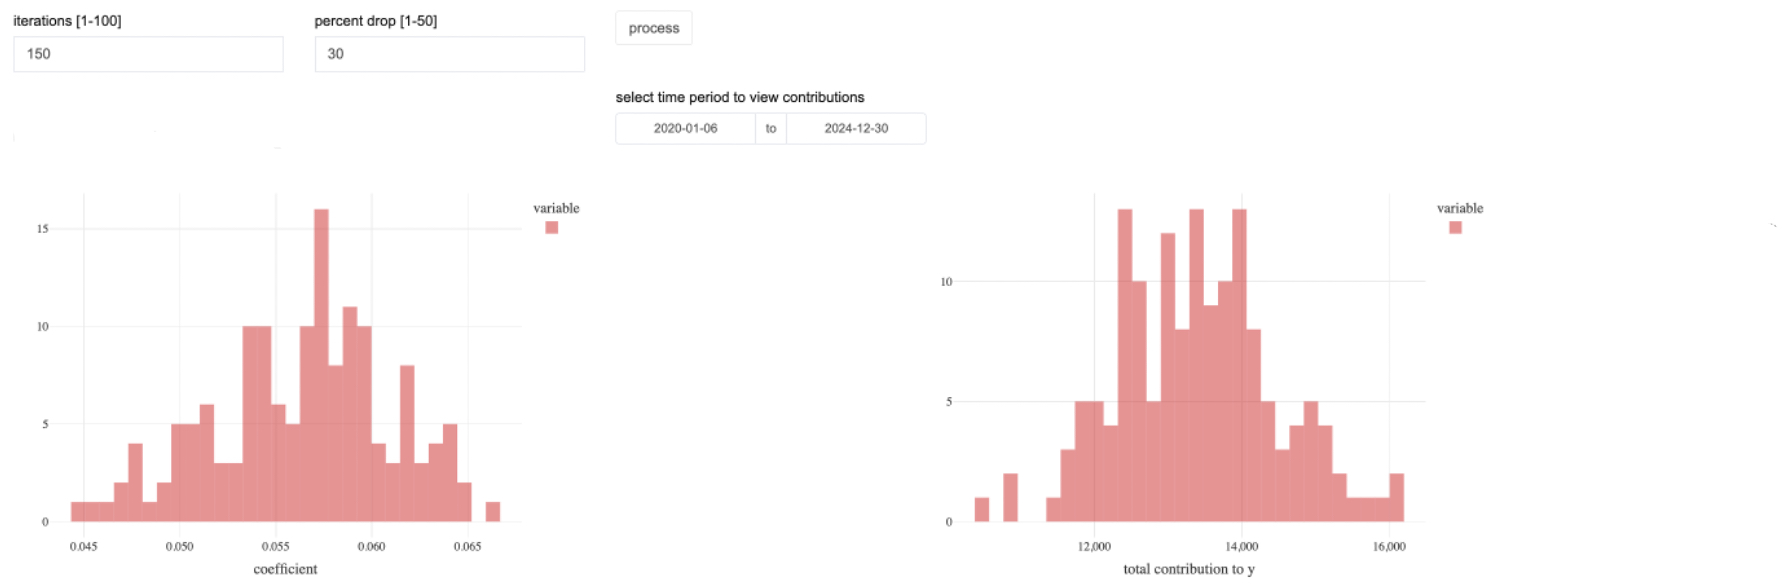
These figures above indicate how changes in the input dataset lead to variability in the model output. Greater changes in the input data, indicated by smaller sample sizes, lead to increased variability. These findings align with the idea that smaller sample sizes typically result in less precise estimates, thereby affecting the reliability of t-statistics/p-values. Even within a fixed sample size, there will still be some variability in the exact estimate of the \(B\) coefficient, which is expected due to the nature of resampling. This variability reflects the inherent uncertainty in the estimate, and it is captured by the range of values within a confidence interval. A 95% confidence interval (CI) for the \(B\) coefficient is designed to encompass this variability.
The 95% CI of the model estimates are not directly shown in the accompanying figures. Although, an underlying distribution can be assumed within a sample. The 95% CI interval is therefore the range in which we would expect the true parameter to lie in 95% of repeated samples, given the same underlying data-generating process.
There are two main components to the code: estimating model coefficients and contributions through resampling. The bootstrap.sample.coefs.table function runs multiple bootstrap iterations to estimate model coefficients, which are then visualized using bootstrap.coef.chart. Similarly, bootstrap.sample.contributions.table performs bootstrap resampling to compute variable contributions and bootstrap.cont.chart visualizes their distribution.
When to use the bootstrapping approach: When we want to assess the uncertainty of an estimate.
Summary
Both approaches provide a nuanced understanding of the reliability of the independent variables under different data conditions. This method strengthens confidence by ensuring that associations are not the result of specific data samples, but are consistently observed across resampling iterations.