How to calculate a counterfactual
This reference guide demonstrates how to calculate a counterfactual for geographic lift testing and some considerations and future developments thereof
Background
In geographic lift testing, a counterfactual refers to a hypothetical scenario used as a comparison to measure the impact of a particular intervention, campaign, or change. Specifically, it is the situation that would have occurred if the intervention had not been implemented. The counterfactual provides a baseline against which the actual outcomes can be compared to determine the effect of the intervention.
In the context of geographic lift testing, this often involves comparing the performance of a treated area (where the intervention took place) to a control area (where the intervention did not take place). The control area should be similar to the treated area in key aspects to ensure that any differences in outcomes can be attributed to the intervention rather than other factors.
For example, if a company launches a marketing campaign in one region (treated area), the counterfactual would be the expected outcomes in that region if the campaign had not been launched. By comparing the actual outcomes in the treated region to the expected outcomes in the counterfactual (control region), the company can estimate the lift or impact of the campaign.
When selecting a group of test and control markets, even in the best cases, it is unlikely that the control market size will perfectly match the size of the test markets. In this case we have to relatively scale-up the control markets to the same size as the test markets during the pre-test period
Take Care/Watch outs
Care should be taken when setting up pre-test periods. Ideally we want to select a long-enough period that the test & control markets can demonstrate that they are sufficiently similar. However, it is possible to fall into the trap of changing your pre-test period to one that gets the “best” results from the test. avoid this type of p-hacking behaviour
When combining markets or dimensions of data, we should pre-aggregate, and where necessary filter, data before commencing the analysis
Simple Case
In an example case below we have 2 markets (“Test” and “Control”) with marketing activity being introduced into the test market at the end of March. The control markets are a good match for the test markets, but are approzimately half the size. In order to calculate the counterfactual (and hence the lift) we need to take the following steps
- calculate the pre-test average for both the test and control markets
- create a counterfactual by multiplying the control market by the ratio of test/control market sizes during the pre-test period
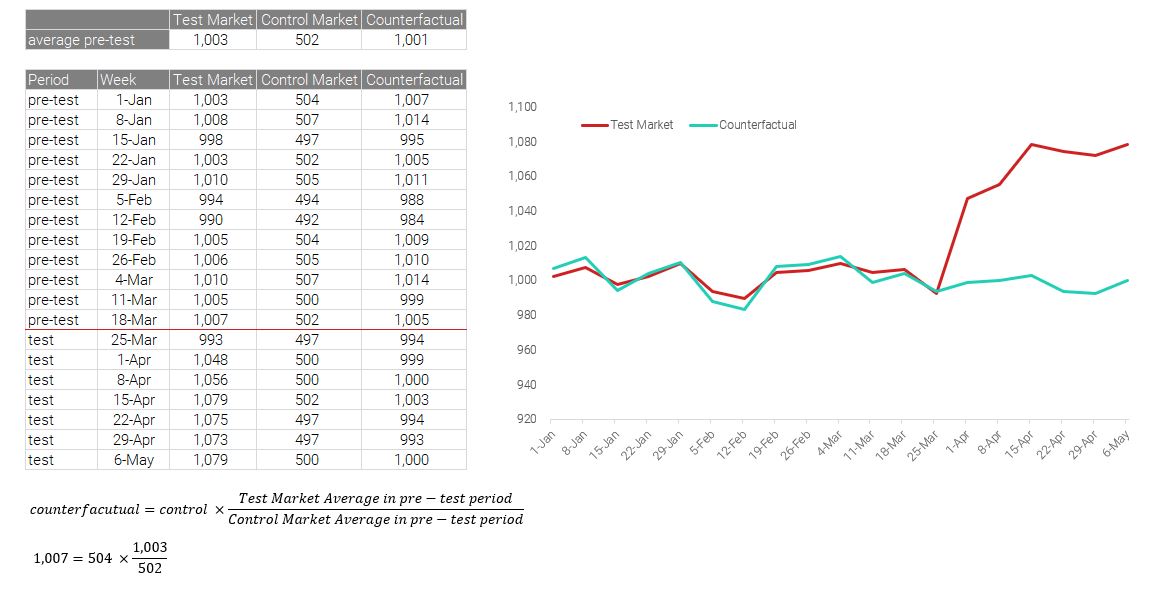
The excel file to step through this calculation can be found here
With this information we can now calculate the difference between the test and counterfactual data series and measure the impact of marketing
R Code Example
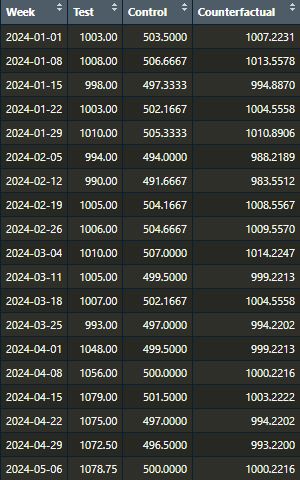
To generate this same calculation in R, assuming that you have a data frame with Week, Test and Control as your inputs, the below code should process and calculate the counterfactual for you. The data to support this exercise can be found here
test.start.date=lubridate::dmy("25-Mar-2024")
test.mean=mean(raw.data$Test[raw.data$Week<test.start.date]) #1003.25
control.mean=mean(raw.data$Control[raw.data$Week<test.start.date]) #501.51

raw.data=raw.data%>%
  dplyr::mutate(Counterfactual=Control*test.mean/control.mean)
This should give the below output.
Advanced Cases
Counterfactual of growth rates are invalid
In some cases it may be advantageous to look at and compare year on year growth rates in different markets. To make this comparison fairly, you should adjust the control groups to scale up to the counterfactual in the period before the prior year data commences and then apply the relative growth rate comparisons.
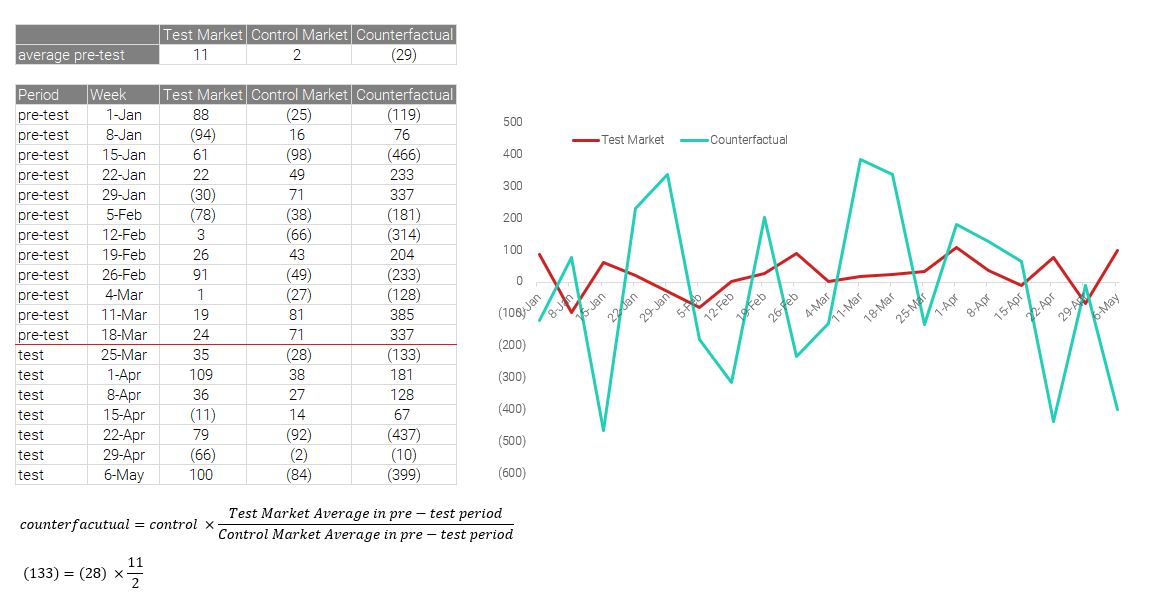
If you take the year-on-year growth rate of the test and control groups, and then try to apply a counterfactual calculation to the control groups, the incorrect values are calculated. The issue here stems from the growth rates in the pre-period having the potential to be very close to 0. If the average growth rate in the test markets is 11 units/day and the growth rate in the control markets is 2 units per day, then the control markets’ growth would be scaled up 5.5 times, making comparisons invalid.
The below shows the potential illustration if you apply a counterfactual after the growth rate has been calculated
Synthetic Control Groups and counterfactuals (further reading & development required)
Some more recent research in this area is listed below, where we can draw insipiration for retrospective identification of counterfactual/control markets and/or investigate further can be found here
Areas of application for this could be in either retrospective test/control studies, or building this into the econometric modeling tool.